WHY CADENCE EXISTS
Built around the questions Plane doesn't answer
Plane tells you where issues are right now. Cadence tells you how long they take, where they get stuck, and when you'll be done.
How long does work actually take?
Cycle time and lead time distributions with P50/P85 benchmarks and a trend line against the prior period. Not just averages that hide outliers.
Where do issues keep getting stuck?
The bottleneck tracker identifies which stage has the highest P85 wait time and detects when the same stage persists as the bottleneck across consecutive measurement windows.
When will we actually finish?
Monte Carlo simulation runs 10,000 samples over your team's real weekly throughput history and returns P50, P85, and P95 completion dates for any backlog size.
FEATURES
Every metric your engineering team needs
Twelve views covering delivery speed, flow health, team output, and risk detection.
Cycle Time
Scatter distribution with P50 and P85 percentile lines. Trend comparison against the prior 30 days so you know if delivery is getting faster or slower.
Lead Time
Created to done, not just active time. Breaks down how long issues actually spend waiting versus being actively worked on.
Bottleneck Tracker
Identifies which stage issues wait in longest. Tracks persistence across consecutive 30-day windows and escalates recommendations when the same stage stays broken.
WIP and Flow
Cumulative Flow Diagram showing how work distributes across stages each day. Spot pileups and flow breakdowns before they become delivery misses.
Team Health
Per-person completion counts, speed percentiles, and automatic flags for overloaded members, slow outliers, and high reactivation rates.
Sprint Comparison
Sprint-over-sprint velocity with P50 and P85 cycle time per sprint. Optional AI retrospective narrative powered by OpenRouter.
Flow Efficiency
Ratio of active working time to total lead time, benchmarked against the industry median of 15%. Per-issue breakdown sorted by efficiency.
Scope Creep
Committed work vs mid-sprint additions, per sprint. Sprints above the 30% danger threshold are highlighted as a leading indicator of missed goals.
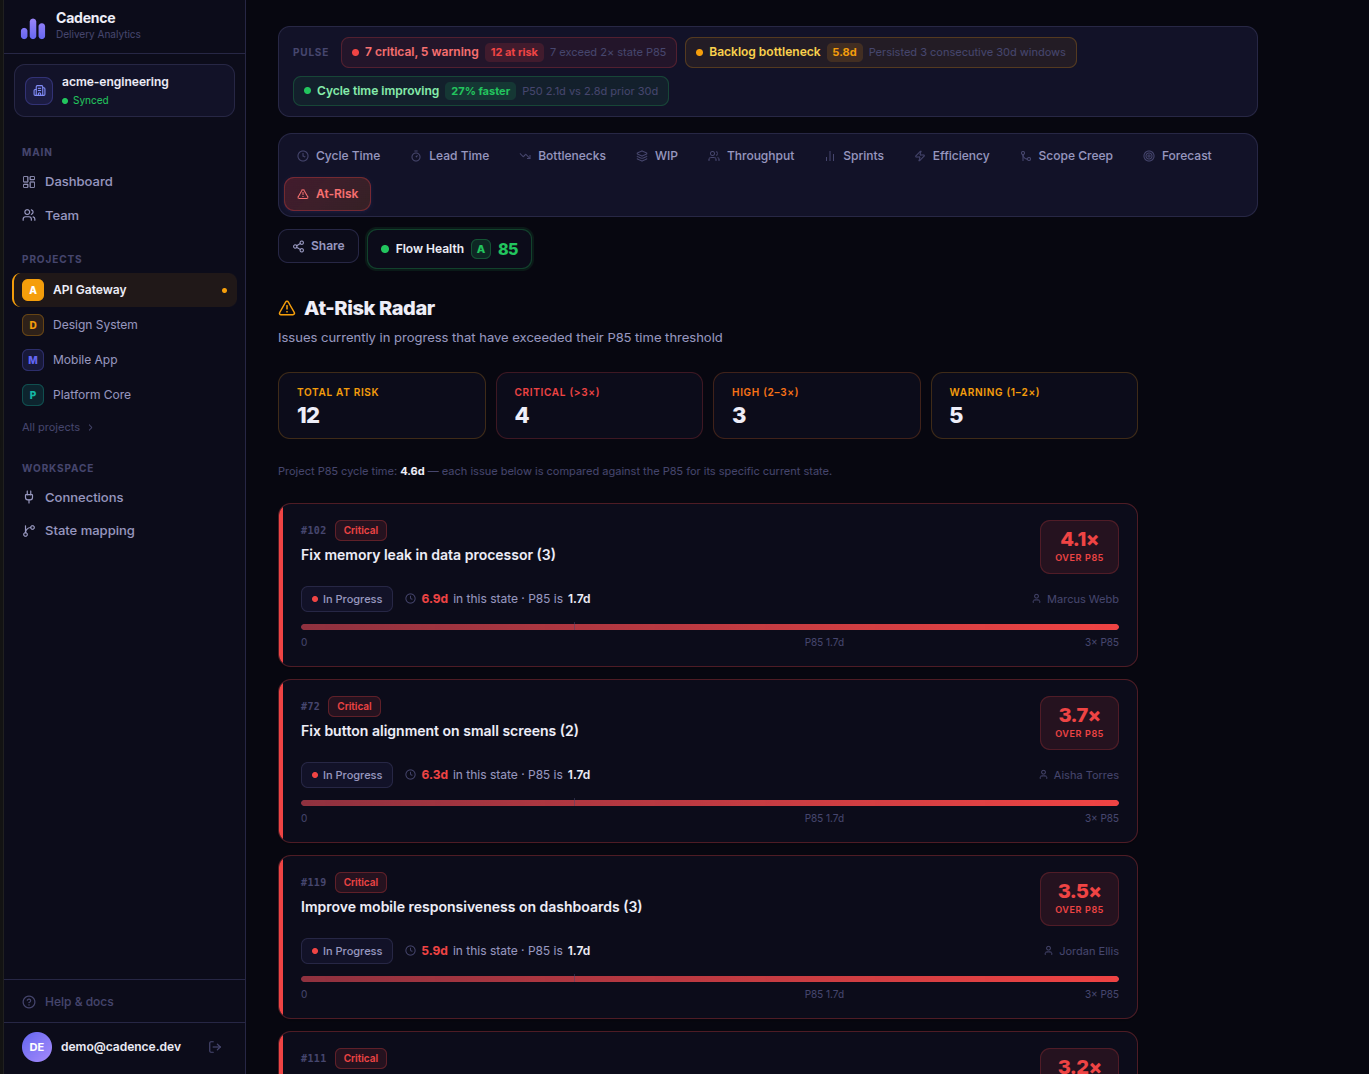
At-Risk Radar
Issues currently in progress that have already exceeded their state P85. Sorted by overage so you know exactly where to intervene right now.
Monte Carlo Forecast
10,000 simulations over your real historical throughput. Returns P50, P85, and P95 completion dates for any backlog size.
Shareable Dashboards
One-click read-only link to any project dashboard. Recipients can view all charts without creating an account.
Real-Time Sync
Webhook support for instant updates on state changes. Backfill queue delivers recent data in under 15 minutes with full history in the background.
SCREENSHOTS
See it in action
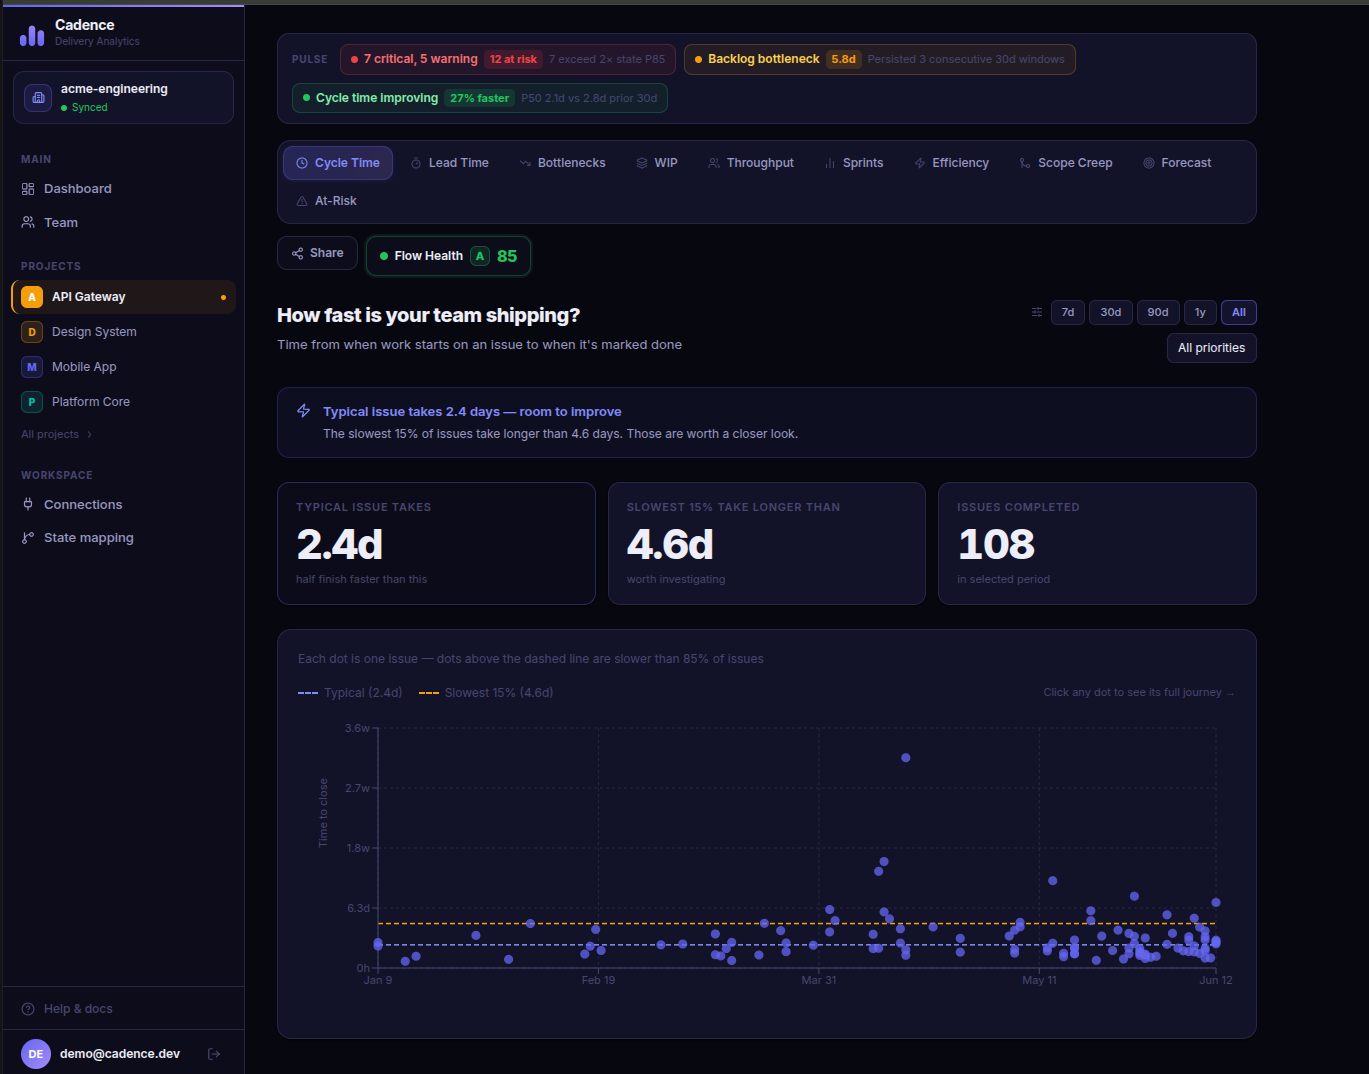
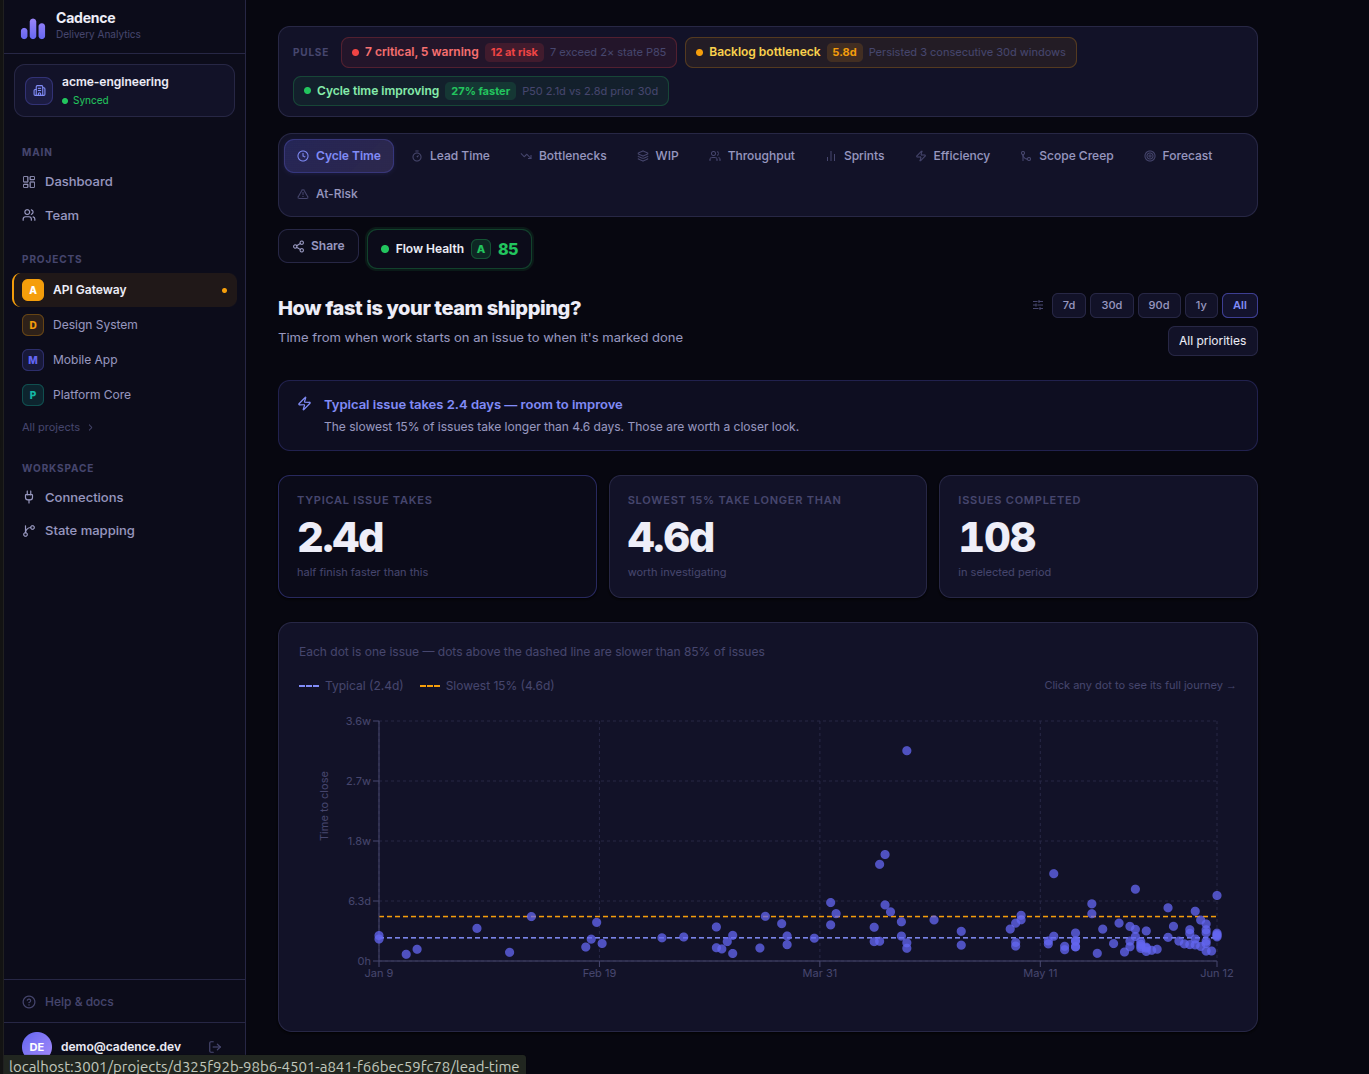
Cycle time with Project Pulse
The Pulse strip at the top surfaces your highest-severity signals on every page: active at-risk count, bottleneck state, and trend direction. The cycle time scatter shows every completed issue as a dot, with P50 and P85 lines and a comparison badge showing how the current period compares to the prior 30 days.
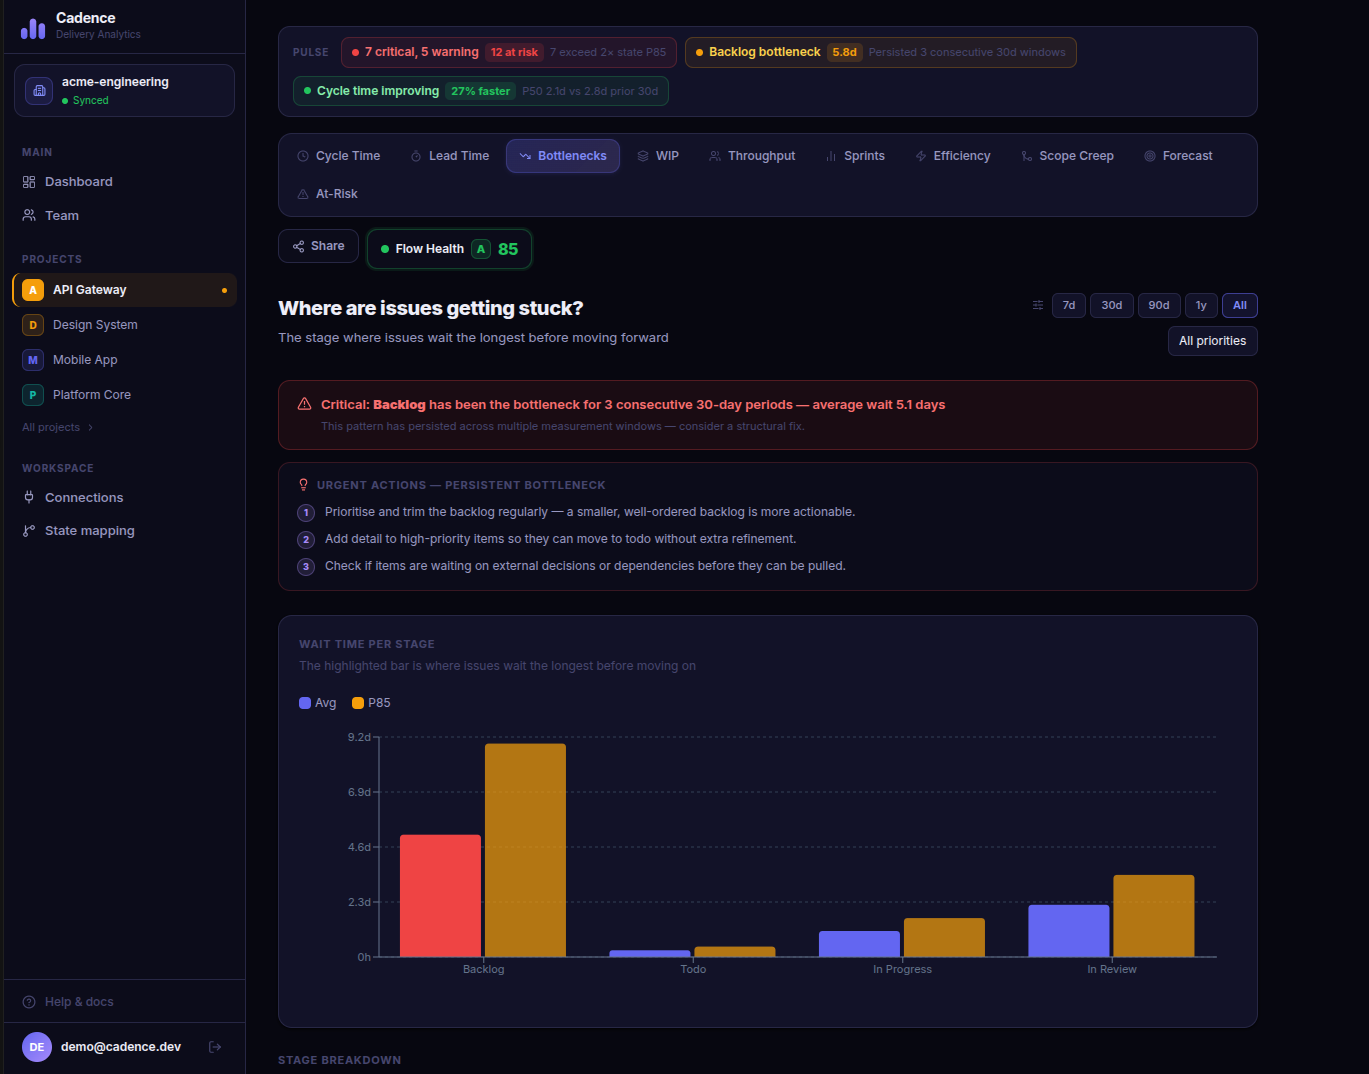
Bottleneck Tracker with persistence detection
Shows the average and P85 wait time per stage as a bar chart. When the same stage has been the bottleneck for three or more consecutive 30-day windows, the alert escalates to Critical and surfaces targeted action recommendations for that stage.
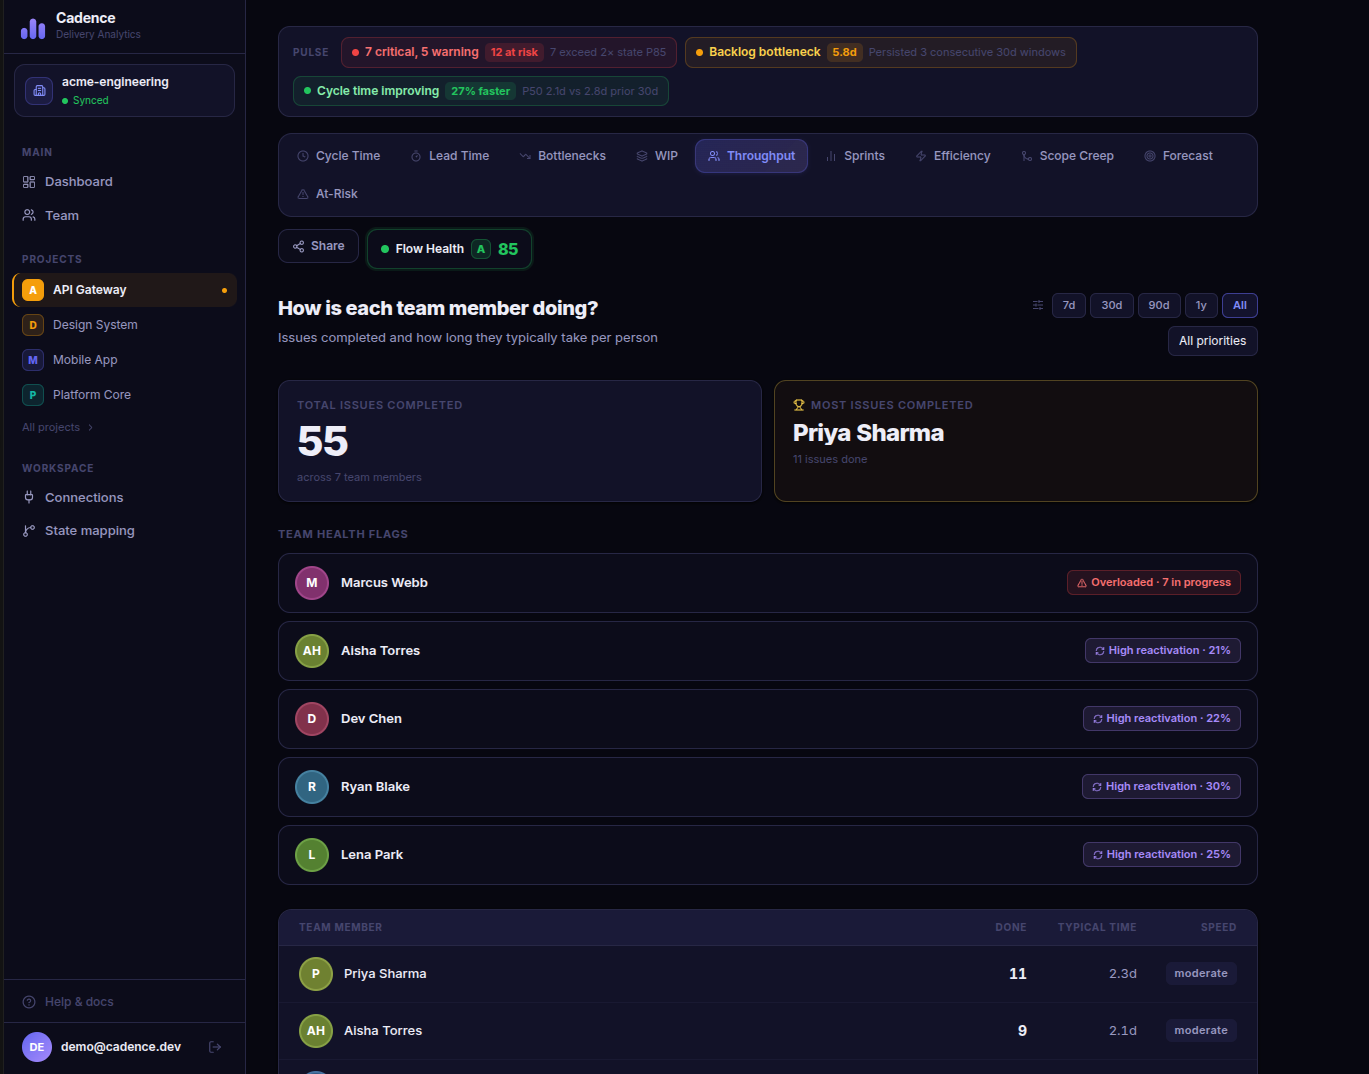
Team Health and Throughput
Per-person issue counts and typical speed. The Team Health Flags section automatically surfaces members who are overloaded (high WIP), slow relative to the team (P85 more than 1.5x the median), or have an unusually high rate of issues being reopened.
At-Risk Radar
Lists every currently in-progress issue that has already exceeded the P85 for its current state. Each row shows how far over the threshold it is, which assignee owns it, and a visual progress bar so you can triage at a glance.
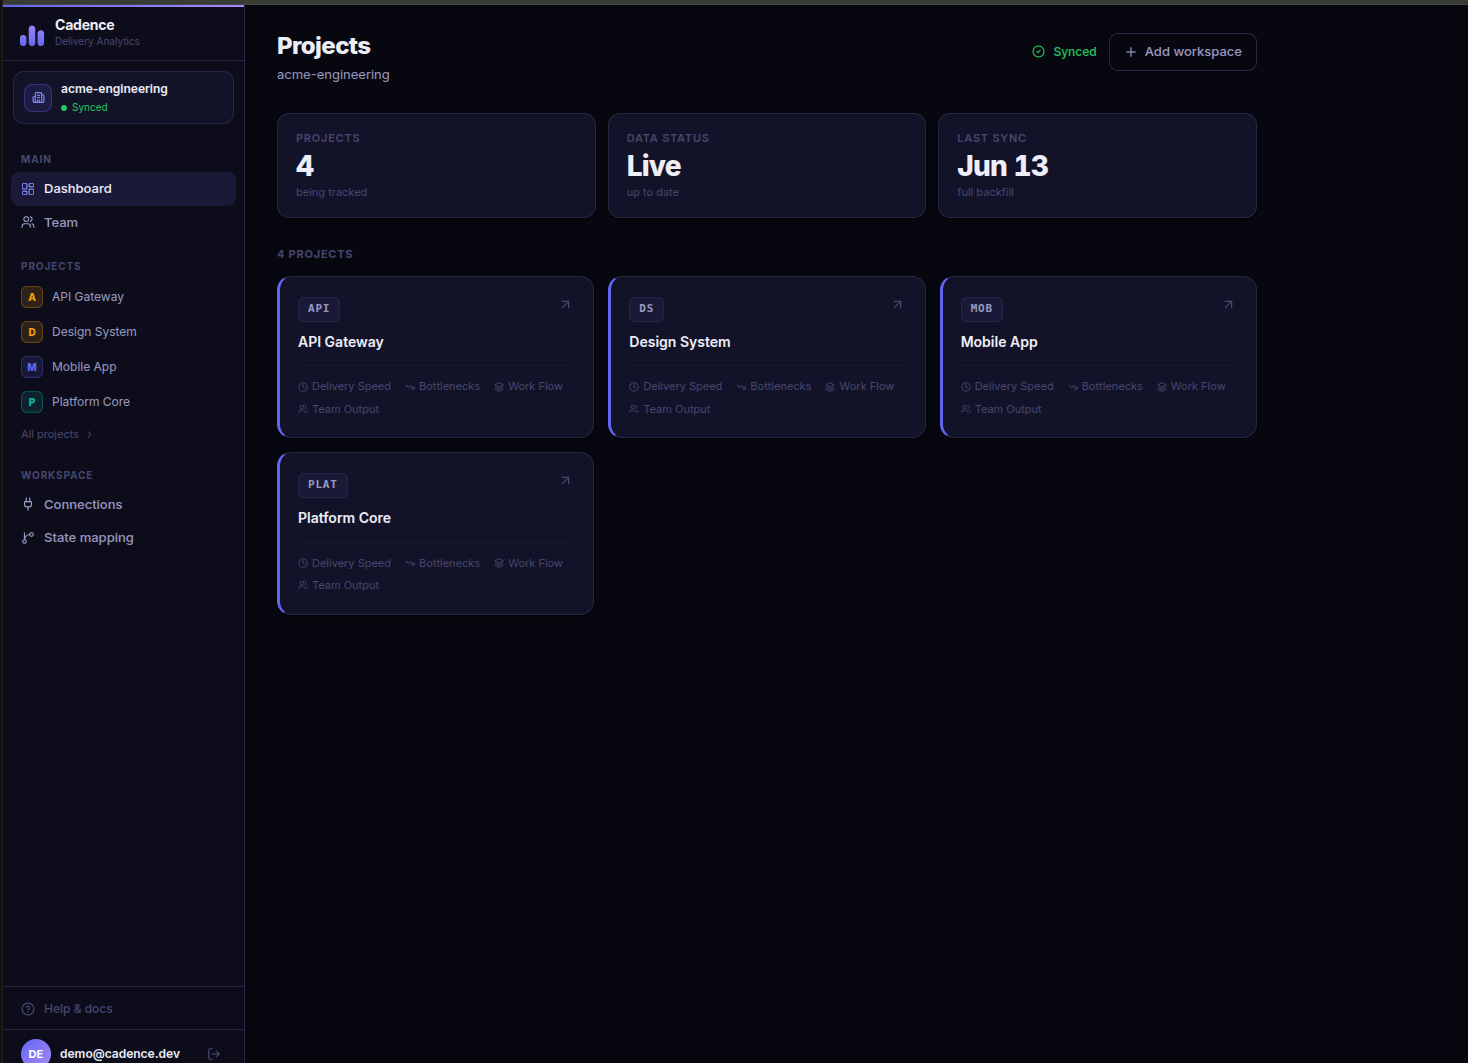
All your projects in one place
The dashboard shows every tracked project with live sync status and quick links to each analytics section. Multiple workspaces can be connected per account, each syncing independently with its own backfill and incremental update queue.
OPEN SOURCE
AGPL-3.0 licensed. Self-host it, fork it, contribute to it.
Cadence is fully open source under the AGPL-3.0 license. Anyone who runs a modified version as a service must also publish their changes. Self-host it, fork it, or contribute — no hidden enterprise tier.
AGPL-3.0: modifications must stay open source if run as a service
Full source on GitHub including migrations, workers, and API
Accepts pull requests for new metrics, bug fixes, and integrations
BUILT WITH
QUICK START
Running in under five minutes
Clone the repo, set three environment variables, and start the stack with Docker Compose. Your first charts are ready before the backfill finishes.